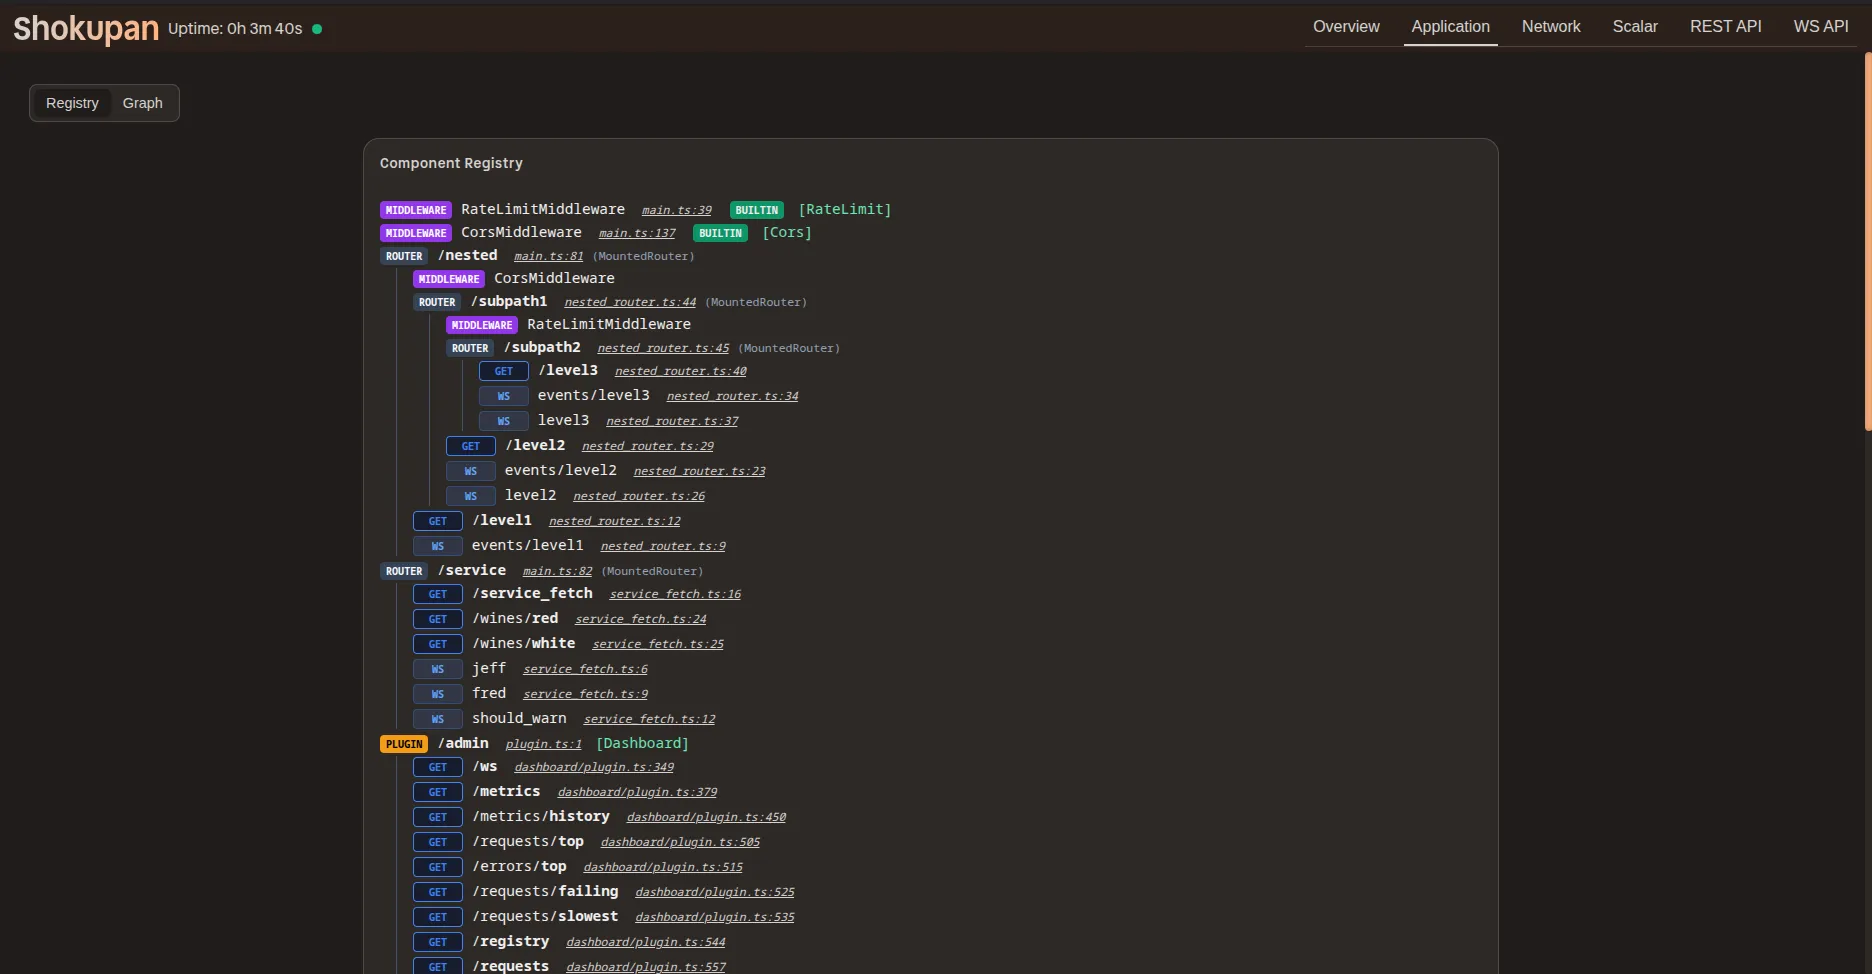
Application registry — a tree view of your application’s structure and registered routes.
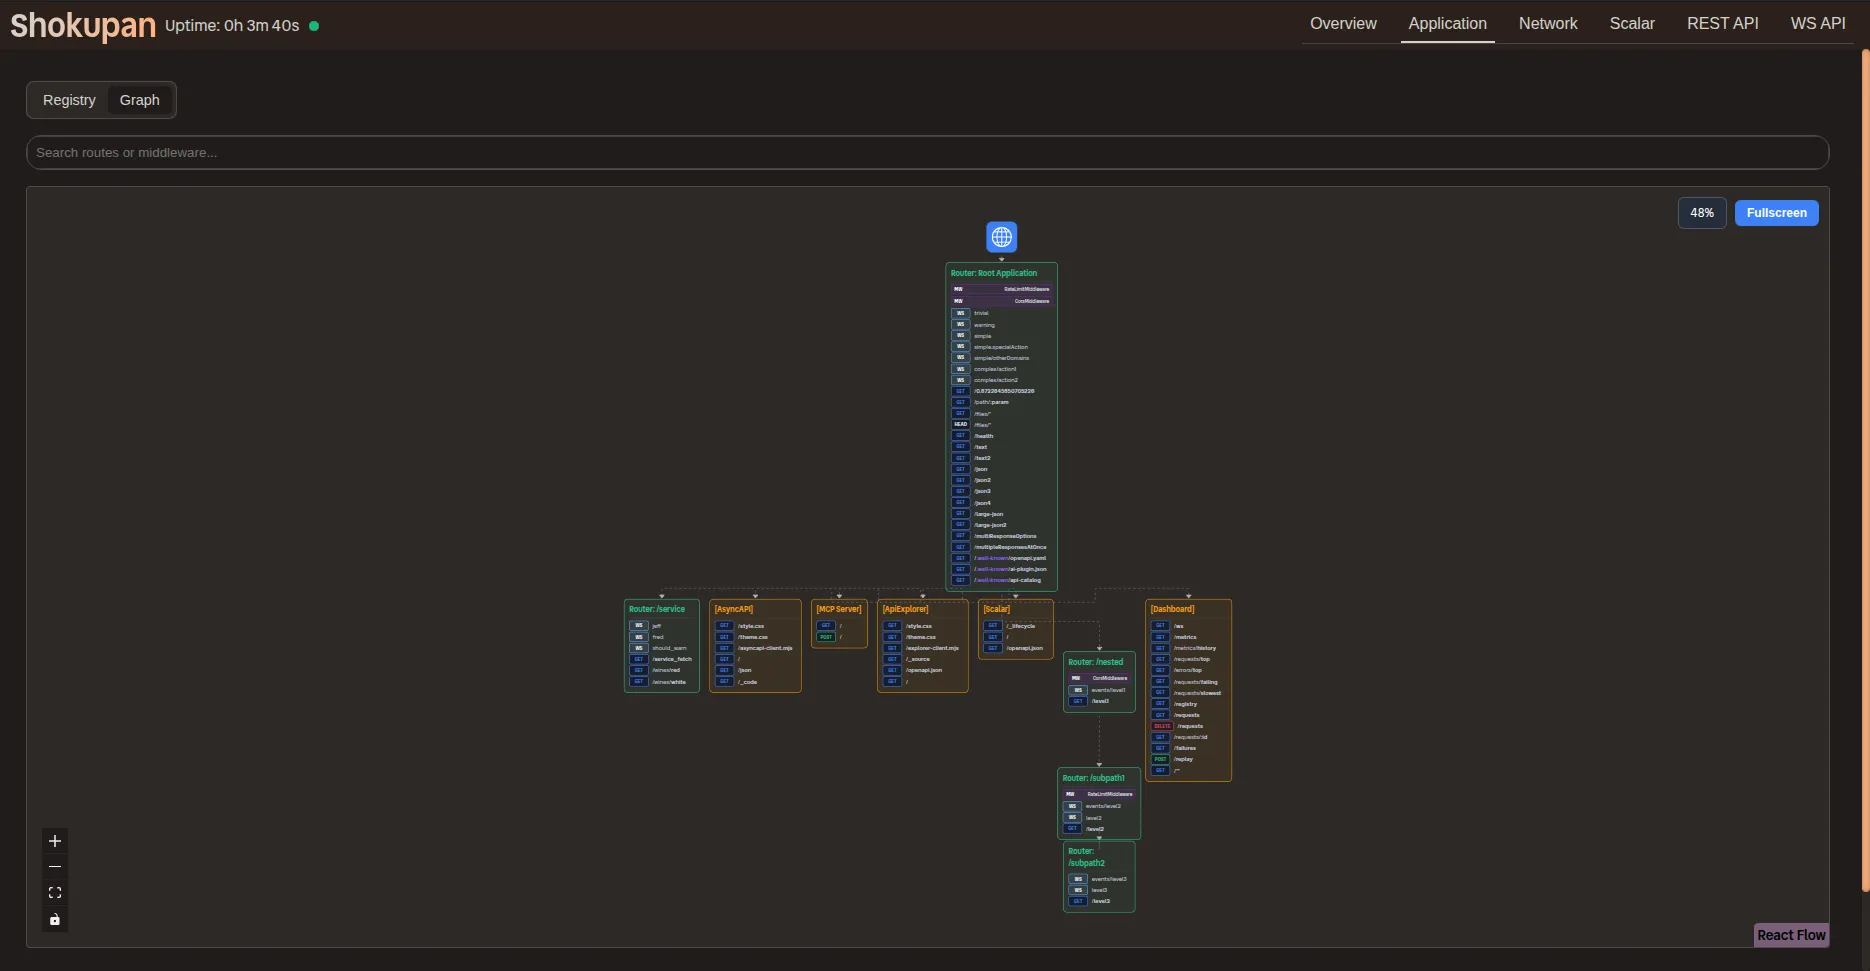
Application graph — a 2D graph view of your application’s structure and registered routes.
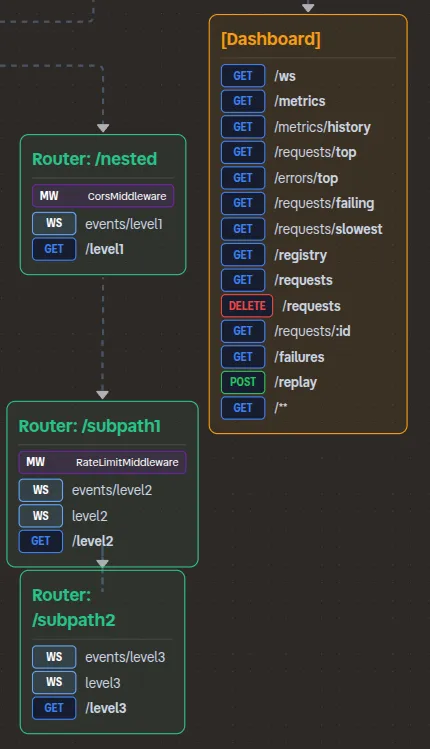
Zoomed in view of application graph — showing node level details.
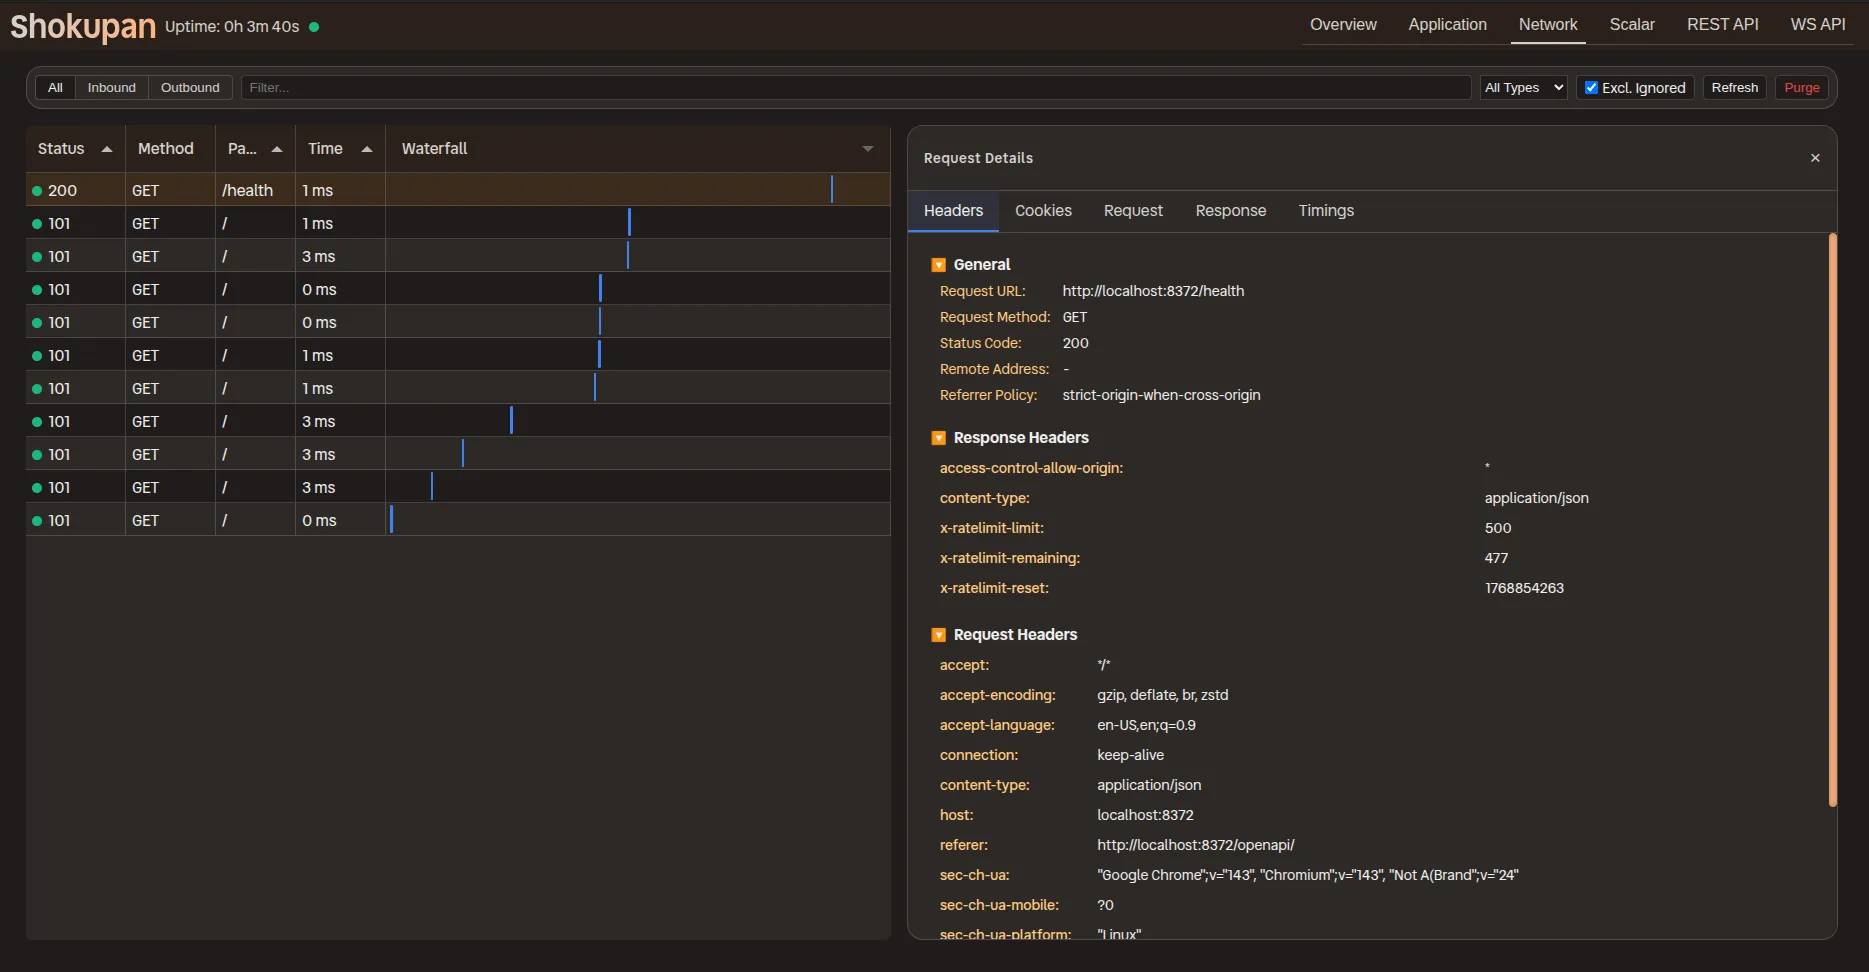
Network overview: A Chrome DevTools inspired interface for inspecting network requests.
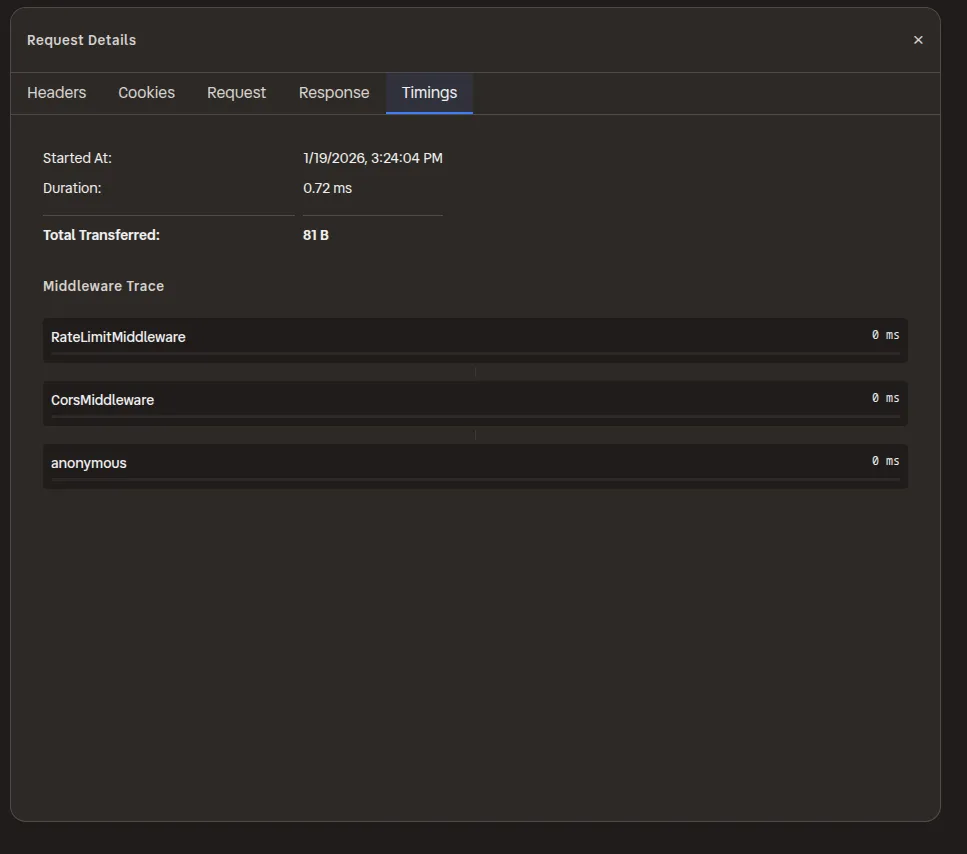
Timings: Inspired by Chrome DevTools, Shokupan records middleware timings provides a clear breakdown.
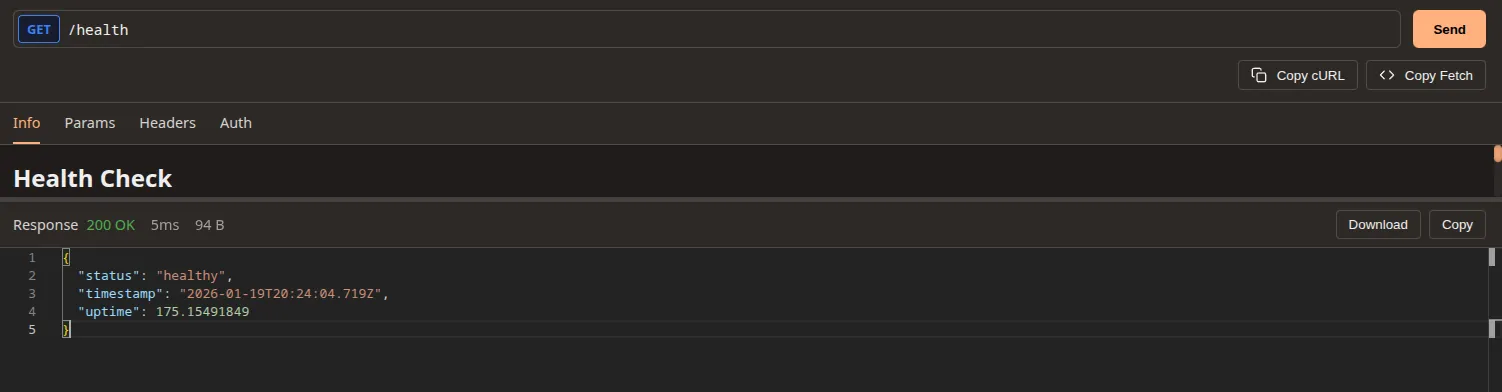
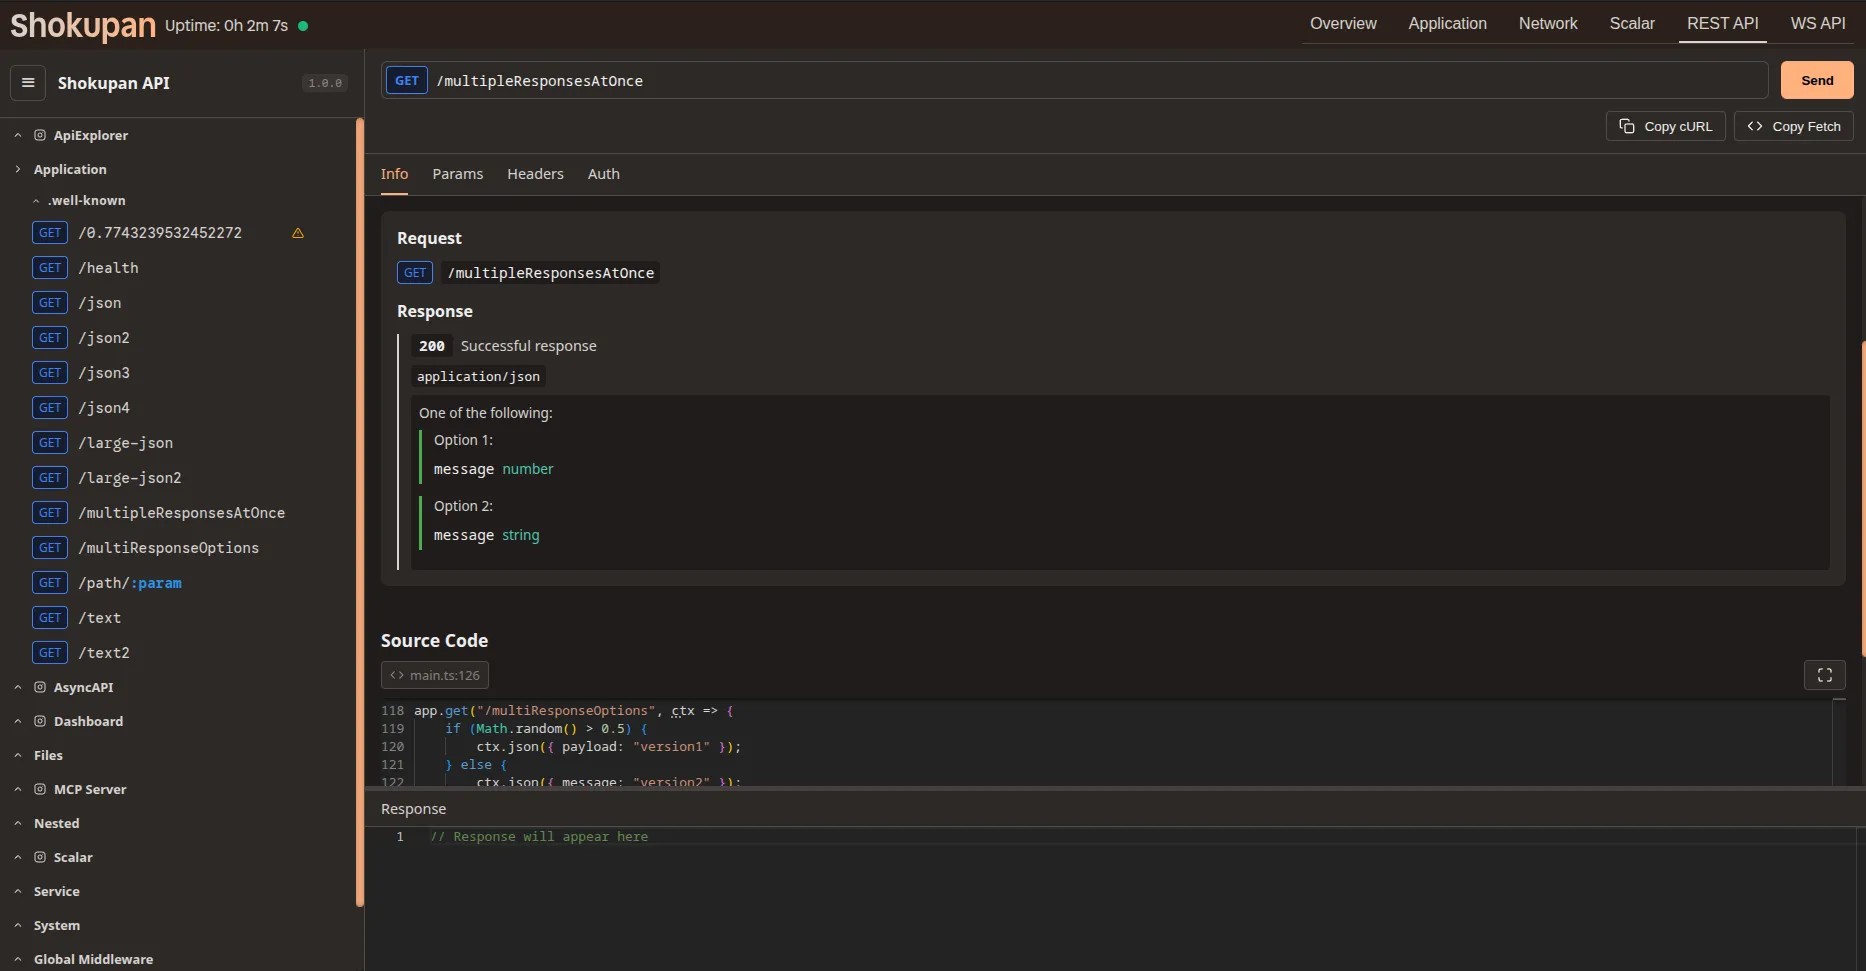
API Explorer: A Scalar inspired interface for inspecting and testing REST APIs. It has specialized support in order to present warnings where metadata could not be statically determined.
Multi-response: Shokupan can document multiple responses formats for a single request.
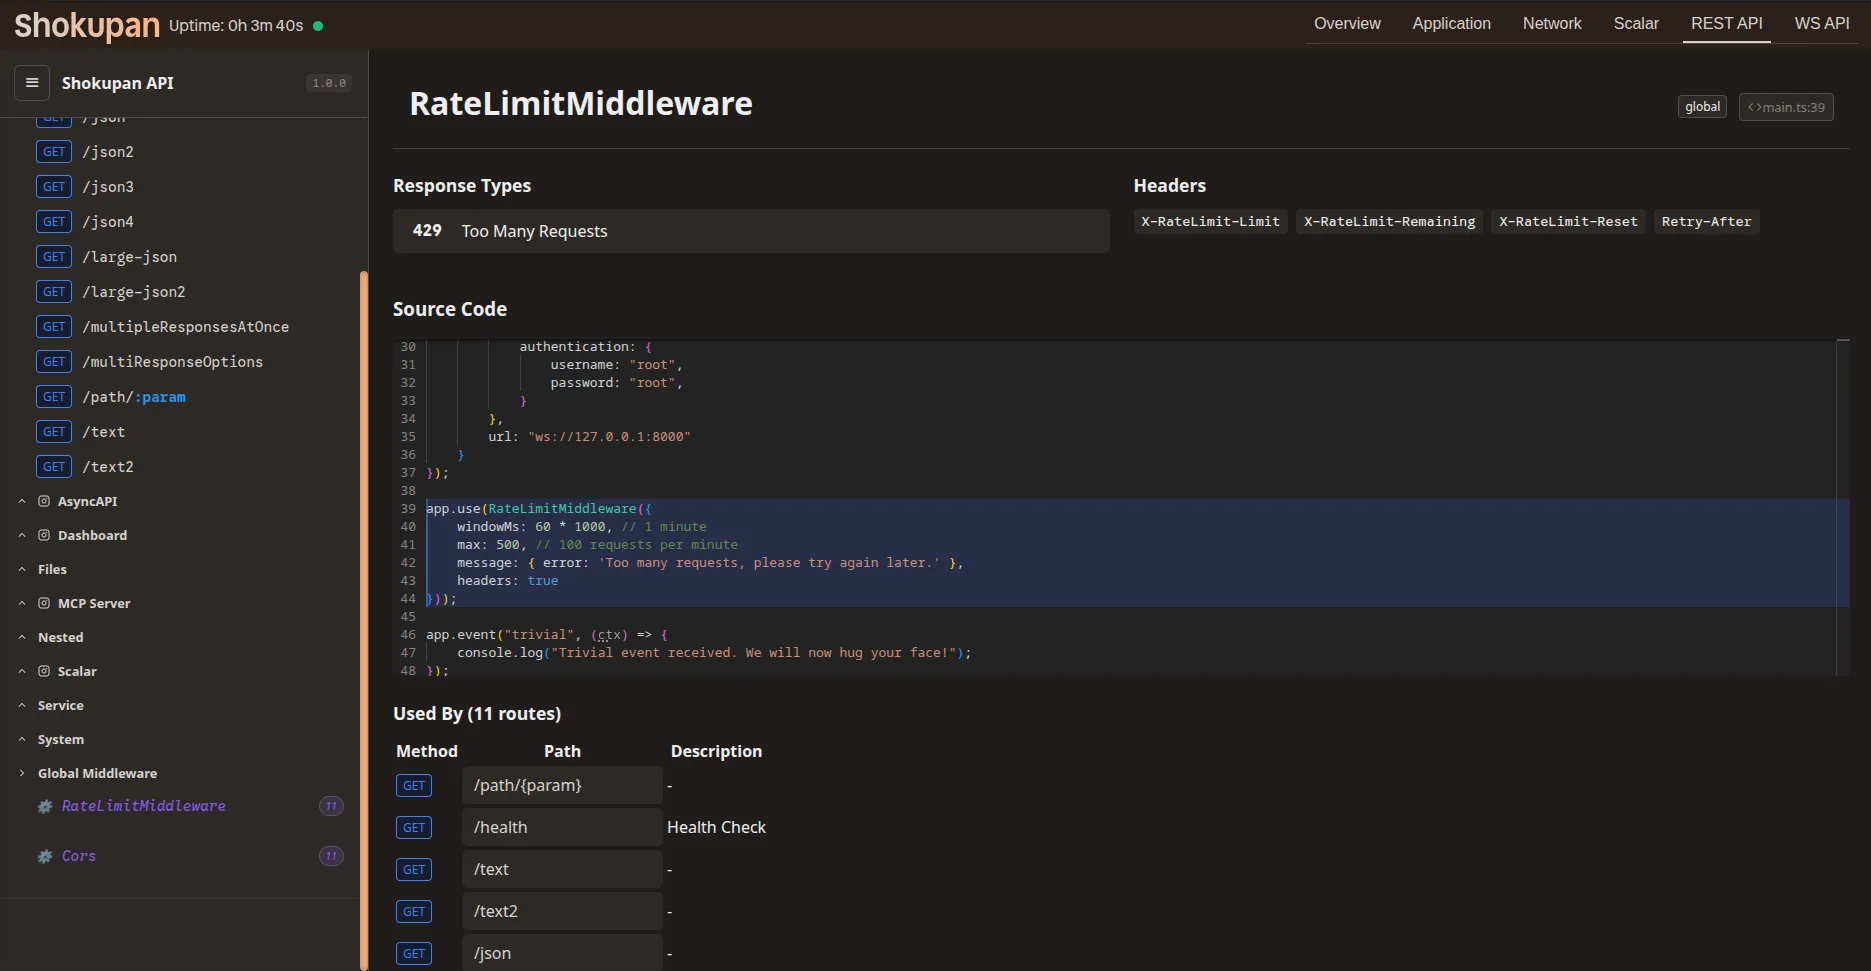
Middleware: Documentation for which endpoints a middleware applies to, as well as the configuration and side-effects of the middleware.
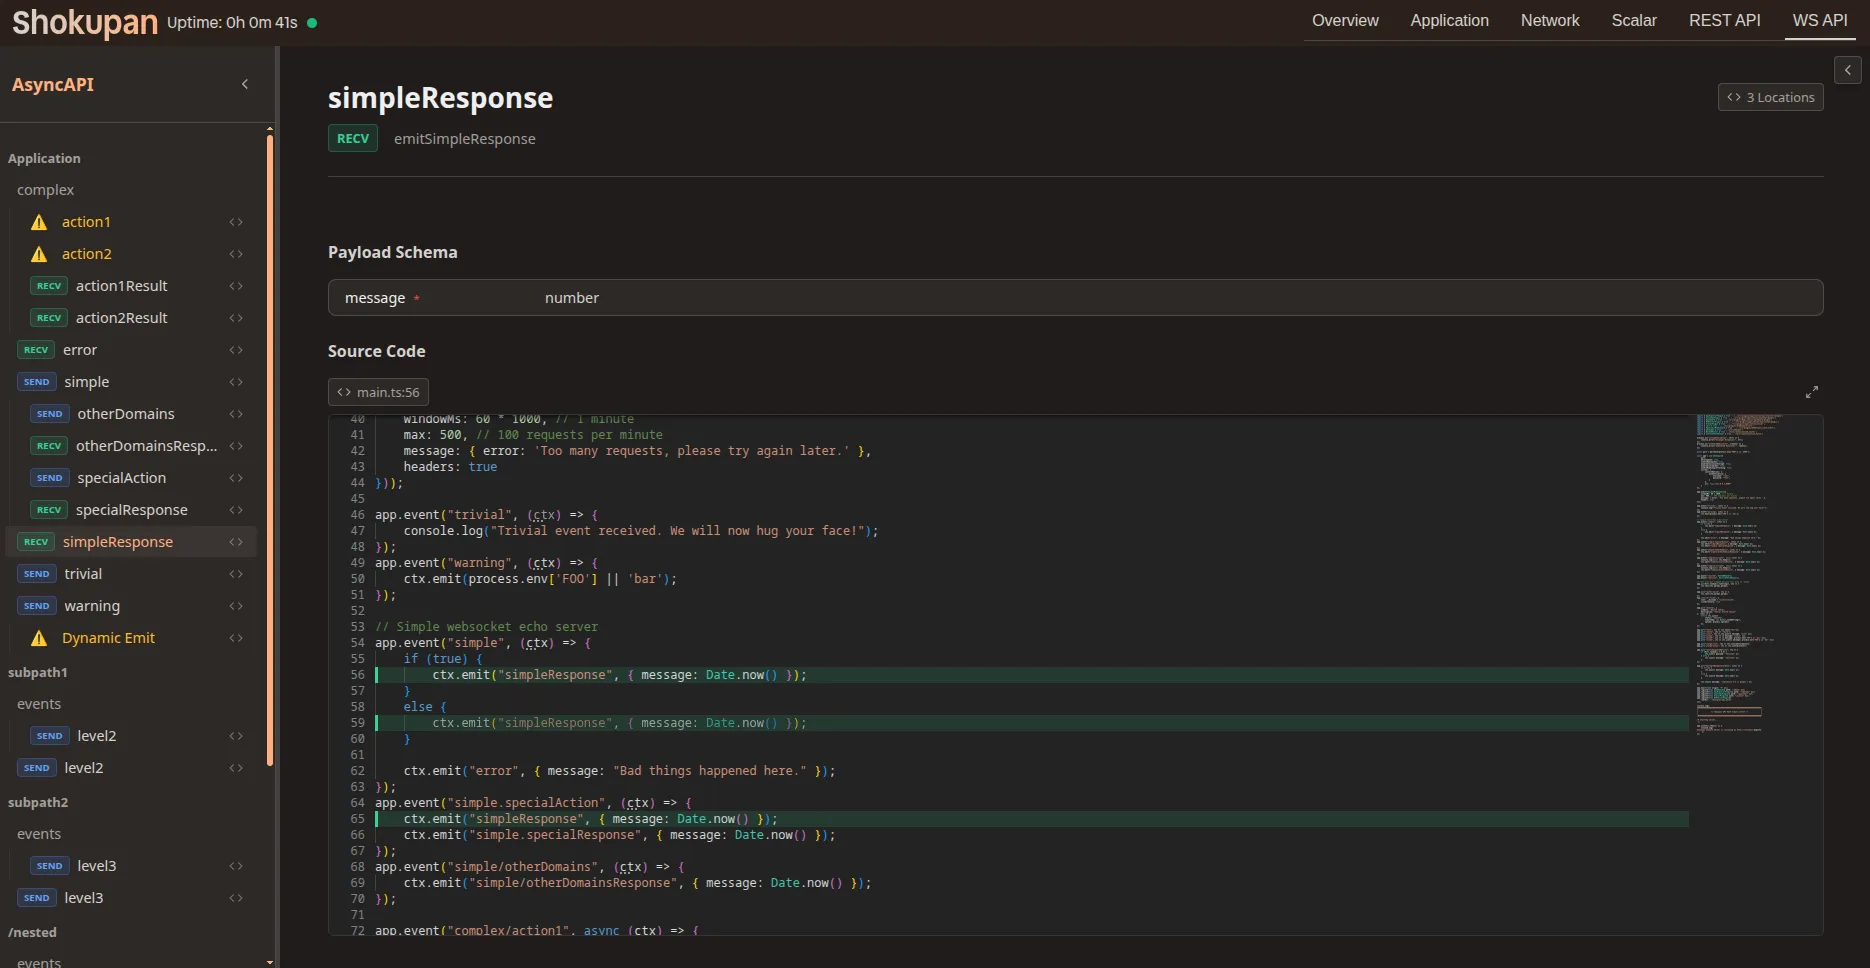
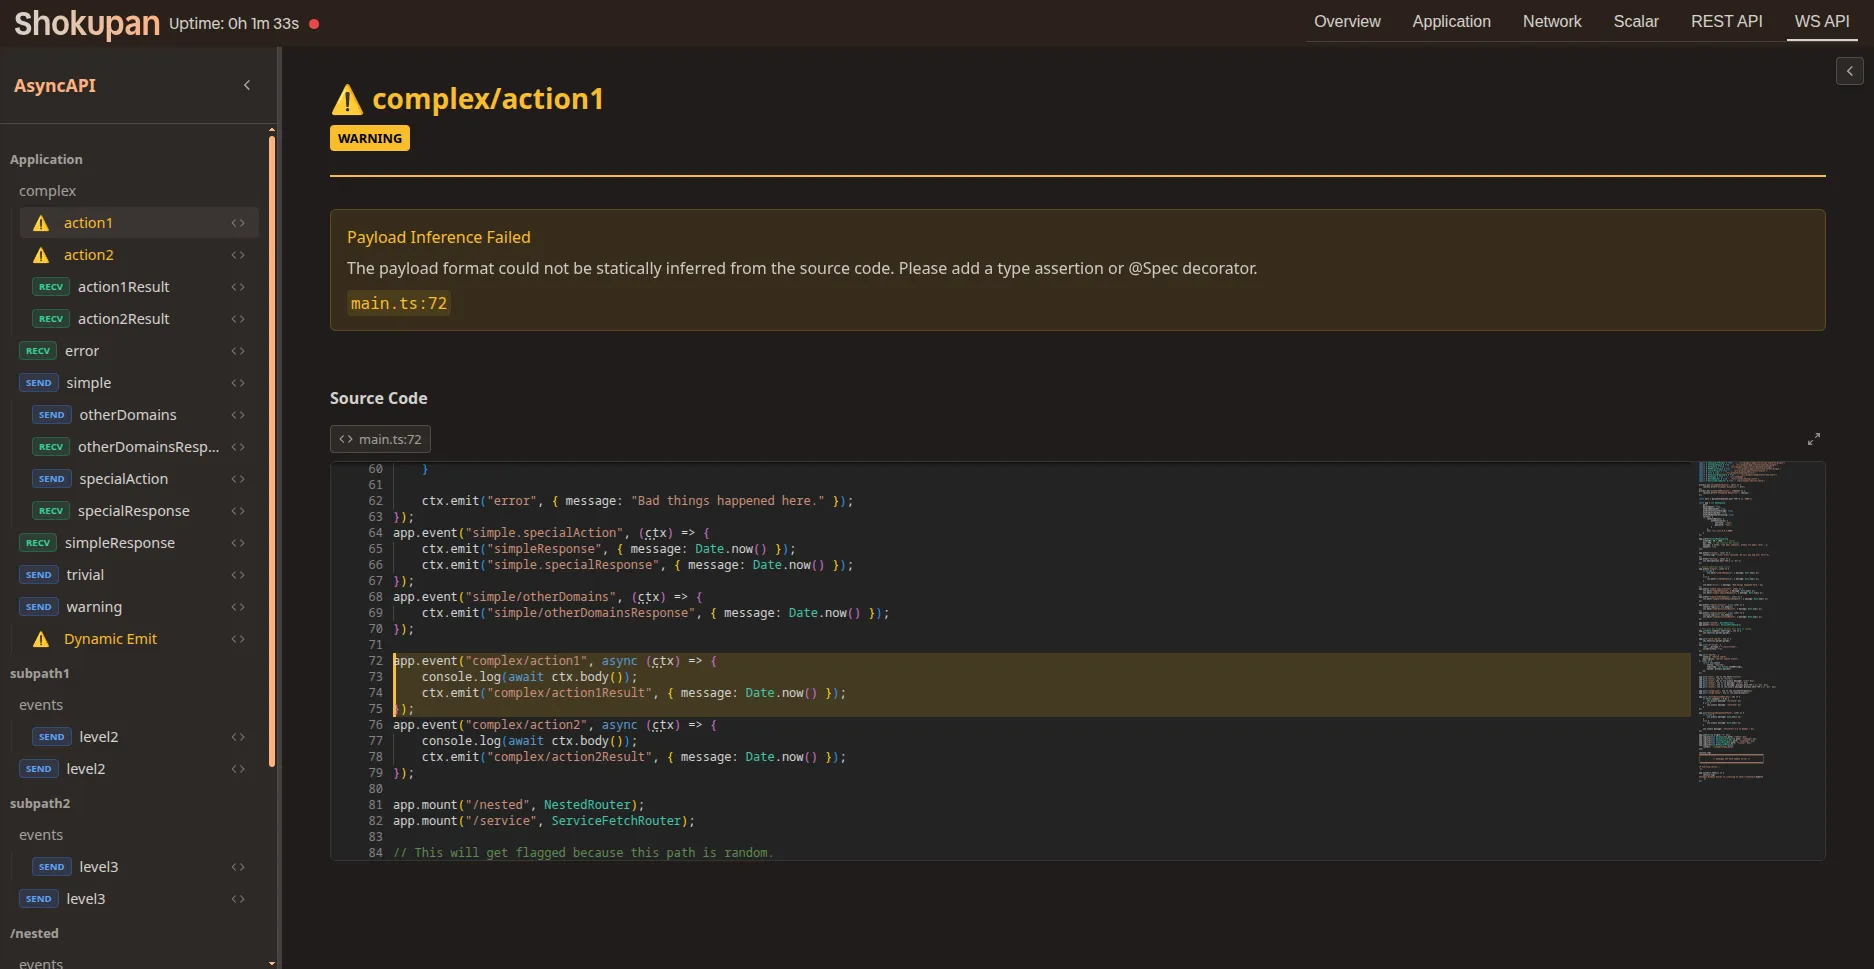
WS Explorer: A Hoppscotch inspired interface for inspecting and testing WebSocket APIs.
Track and display state mutations made by middleware.
Requires enableMiddlewareTracking to be enabled on the application.
When enabled, the dashboard will show what properties each middleware added/modified on ctx.state.
Strategy for pushing request updates to the dashboard.
‘immediate’ - pushes every request as soon as it completes.
‘batched’ - buffers requests and pushes them at the interval specified by updateInterval.